|
Binomial Distributions
A binomial distribution has the form;

with a mean of

variance of

and standard deviation of

The binomial distribution is the discrete probability distribution of the number of "successes" (positive results) in a sequence of n independent yes/no experiments, each of which yields a "success" with a probability of p. Let's see an example.
An Example
Imagine you flip a coin 4 times in a row. Here are the possible outcomes:
TTTT = 0 heads
HTTT = 1 Heads
THTT = 1 Heads
TTHT = 1 Heads
TTTH = 1 Heads
 TTHH = 2 Heads TTHH = 2 Heads
HHTT = 2 Heads
THHT = 2 Heads
HTTH = 2 Heads
THTH = 2 Heads
HTHT = 2 Heads
THHH = 3 heads
HTHH = 3 heads
HHTH = 3 heads
HHHT = 3 heads
HHHH = 4 heads
The above shows that if you flip a coin 4 times in a row, you can get anything from zero heads all the way up to 4 heads. The probability of getting heads zero, once, twice, three, or four times for an unbiased coin are respectively 1/16, 4/16, 6/16, 4/16, 1/16. When we plot this as a histogram, we are plotting the distribution.
Use The Formula, It's Quicker
Rather than writing out every possible iteration and counting up results as we did above, let's use the formula at the top instead.
For example, let's calculate the probability of 2 heads coming up in 4 throws. That means that k=2, n=4, and since we are using an unbiased coin, p=1/2. Subbing the values into the equation from the top we get;


Let's see how it works for heads coming up zero times in 4 throws (k=0, n=4, p=1/2)

keeping in mind that

thus


Success! I'll leave it to you to try the other two scenarios (k=1 and k=4).
The Mean, Variance, and Standard Deviation
The mean of the distribution that forms from 4 flips of an unbiased coin is:


Which seems correct when we look at the distributions.
The variance is


Finally the standard deviation is

Let's Supersize our Coin Flips
So now that you know how to do the calculations, let's look at some other results.
Flipping a coin 10 times (n=10 p=1/2), for k's 0-10 we get the following probabilities:
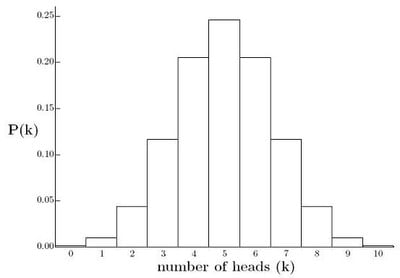 1/1024 1/1024
10/1024
45/1024
120/1024
210/1024
252/1024
210/1024
120/1024
45/1024
1/1024
mean=5
variance=2.5
standard deviation=1.58
20 Flips
Flipping a coin 20 times (n=20 p=1/2), for k's 0-20 we get the following probabilities:
1/1,048,576
20/1,048,576
190/1,048,576
1140/1,048,576
4845/1,048,576
 15504/1,048,576 15504/1,048,576
38760/1,048,576
77520/1,048,576
125970/1,048,576
167960/1,048,576
184756/1,048,576
167960/1,048,576
125970/1,048,576
77520/1,048,576
38760/1,048,576
15504/1,048,576
4845/1,048,576
1140/1,048,576
190/1,048,576
20/1,048,576
1/1,048,576
mean=10
variance=5
standard deviation=2.24
 100 Flips 100 Flips
Flipping a coin 100 times (n=100 p=1/2), for k's 0-100 we get the following probabilities:
mean=50
variance=25
standard deviation=5
Poisson Distribution
The Poisson distribution can be derived from the binomial distribution by making a few assumptions. I recently did this derivation in my other blog on CR4. Please check it out if you're interested.
| 


 Re: It's a Coin Flip by Roger Pink