|
Ninety years ago, a mechanical engineer developed a horizontal bar chart that would revolutionize project management. In 1917, Henry L. Gantt designed the first Gantt chart, a graphical representation of a project's timeline, tasks, elements and dependencies. Gantt developed his project management tool during World War I, while working as a management consultant for an American shipbuilder. Later, he published his principles for Gantt charts in Organizing for Work (1919), a book which influenced generations of project managers.
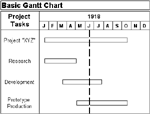
Henry L. Gantt drew the first Gantt chart on a piece of graph paper. The horizontal axis represented the project's total time span. The vertical axis represented all of the project's tasks. Horizontal bars of varying lengths depicted the timing, sequence and duration of individual tasks. Longer bars indicated longer tasks, while shorter bars indicated shorter tasks. As some or all of a task was completed, Gantt shaded its bar accordingly. In this way, Gantt could provide company executives and non-managers with an understanding of project flow that did not require a complete tutorial in project management.
Traditional Gantt charts are useful, but have three significant limitations. First, because task sequencing and task relationships are not depicted, Gantt charts do not let project managers see how the delay or acceleration of one activity will affect associated activities. Second, because each task has a single start date and a single end date, Gantt charts cannot show the results of an early start or a late start for an activity. Third, because Gantt charts cannot show an activity's variability, questions about the minimum or maximum duration of a task cannot be represented.
During the twentieth century, Gantt charts were used to plan major construction projects such as the Hoover Dam (1931) and the Eisenhower Interstate Highway System (1954). They were also used in the Manhattan Project, a top-secret U.S. government program to build an atomic bomb during World War II. Although these first Gantt charts were drawn by hand, most project managers now use computer hardware and software. During the 1980s, projects schedulers began to use personal computers (PCs) and desktop applications. In the late 1990s and early 2000s, Gantt charts became a common feature of web-based applications, including collaborative groupware. They also began to use task lines to show dependencies.
Resources:
https://en.wikipedia.org/wiki/Henry_Gantt
https://en.wikipedia.org/wiki/Gantt_chart
https://www.12manage.com/methods_gantt_chart.html
| 


 Re: The Gantt Chart Turns 90
